Visualising data/activity: Difference between revisions
From OER in Education
JanetBlair (talk | contribs) No edit summary |
JanetBlair (talk | contribs) No edit summary |
||
| (One intermediate revision by the same user not shown) | |||
| Line 21: | Line 21: | ||
* Students measure various quantities (including but not limited to; arm length, height, hand span) and then analyse this data to look for patters of distribution amongst the class | * Students measure various quantities (including but not limited to; arm length, height, hand span) and then analyse this data to look for patters of distribution amongst the class | ||
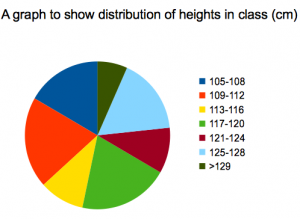
* The spreadsheet allows graphs showing the data to be drawn instantaneously as the data is inputted helping student visualise the variation/distribution of the data within the class | * The spreadsheet allows graphs showing the data to be drawn instantaneously as the data is inputted helping student visualise the variation/distribution of the data within the class | ||
[[File:SC0012_screenshot.png|thumb|none|alt=Graph of collected data.]] | |||
|- | |- | ||
Latest revision as of 12:19, 19 June 2012
| Subject | Science |
| Activity Name | Variation of human characteristics |
| Learning Objectives |
|
| Outline of activity |
|
| Technology requirements and skills | Computer with spreadsheet software and template file (File:Class Data Set.ods).
|
| Equipment requirements |
|
| Possible extension or supplementary activities |
|
| Suggestions of what ‘successful’ student understanding or work might look like |
|

