| Blogs
|
Write for an online audience
|

|
Writing for a public audience when blogging can encourage pupils in their language(ta) development and offers opportunities for ICT mediated assessment(ta) including peer assessment(ta) for example via the use of the 'comment' features. Still a popular approach to language teaching, and still underused, blogs(tool) offer the easiest of ways to publish school news or lab discoveries or whatever winds me up today. Blogging websites allow video and photos to be included alongside text. For example, underneath each post is a comment button which gets feedback - but you can control what happens with a setting.
Each of the blogging web sites below offer an overwhelming range of features. All of them generate a 'feed' (RSS feed) where a reader can subscribe to new posts. The RSS is used to alert your readership of new articles, rather than have them re-visit a site that does not change.
Services that offer blogging include, BLOGGER (www.blogger.com); WORDPRESS (www.wordpress.org) and TYPEPAD (www.typepad.com).
|
| Programming
|
Write an app for any mobile device
|

|
Encouraging pupils to reason(ta) about user needs in app development, and coding to develop apps involves use of higher order(ta) reasoning(ta). Despite its perception as a solitary activity, in a classroom talking about how to solve problems, and address user needs offers opportunity for group talk(ta) and whole class(ta) dialogue(ta). Program(tool)apps(tool) using a web-based tool at BUZZTOUCH (www.buzztouch.com). You assemble screens for your app, compile its source code and open your project in Xcode for iOS or Eclipse for Android. Both teachers and students are allowed to write 'apps', indeed some parts of the curriculum would value the opportunity to do so.
|
| Draw
|
Draw diagrams and collaborate
|

|
Drawing tools offer opportunity for higher order(ta) visualisation(ta) and collaboration(ta), as well as stimulus for whole class(ta) dialogue(ta) and questioning(ta). Use a web browser to draw(tool) a picture, flowchart or diagram based on a library of clip-art ‘stencils’. For example, you could use the flowchart templates to create a topic map and then share it with the rest of the class. More than a presentation tool, this also allows more than one student to work on the same diagram. A chat(tool) window facilities this collaboration(tool). Drawings can be exported to a file to use elsewhere or embedded in a blog page.
|
| Chat
|
Talk with your students in an online chatroom
|

|
Chat rooms afford opportunity for collaboration(ta), group work(ta), and group talk(ta). They can offer opportunities for dialogic teaching(ta) through the use of group based effective questioning(ta). Many chat tools also integrate with other Tools. You can set up a chat(tool)room at “chatzy.com”. Then publish the link to the room, and perhaps a meeting time, to allow an out of class discussion(ta). You could use this tool to have an out-of-class discussion (perhaps someone is unwell). Can an online chat make dialogue more effective? Can it make group discussions more inclusive?
|
| Mindmap
|
Brainstorm ideas and documents
|
|
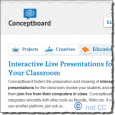
Conceptboard and other mindmapping(tool) tools facilitate higher order(ta) reasoning(ta) and visualisation(ta) of concepts and their relationships. They can be useful discussion(ta) prompts, or help pupils develop their language(ta) skills for written work. CONCEPTBOARD (http://www.conceptboard.com) offer a shared screen to discuss and brainstorm(tool) ideas and documents. It could be used to discuss a project with different users working on different devices. They can of course work remotely with video or work collaboratively on a whiteboard.
Conceptboard is an alternative to trying to collaborate(tool) via emails that run back and forth. It was designed to enable team work and group conferencing. If you can imagine a publisher and designer brainstorming a page layout and annotating it using various tools, then you can probably see a group of students usefully working on a shared piece of work.
|
| Data logging
|
Collect and handle data from experiments
|

|
Data logging tools provide opportunity to engage pupils in the scientific method(ta) and higher order(ta) reasoning(ta) and problem solving over data collection and analysis. They can be used collaboratively(ta) or individually in inquiry(ta) based learning. Data logging is the process of recording measurements from sensors. A weather station pretty well fits this definition. The station captures readings from sensing devices and it may also display what is happening right now. The station offers a better way to study the world. While many people would say that measuring with technology is more accurate; more modern or 'the way to go', the real benefits are the important advantages for learning. Some are less than obvious:
- You can monitor extremely fast or tediously slow events. Thus you can now investigate a whole range of things you would have needed to overlook.
- You can design and make equipment to solve problems for 'technology or D&T' projects.
- You can measure tiny changes with precision - for example to find out whether wearing white clothes could offer comfort on a hot day. The measured difference between black and white clothes is slight, by the way.
- You can see results appear live and immediately, get a tacit understanding for what’s happening. This incidentally lets you modify your experiment when you see readings going awry.
- You can gain data to analyse, evaluate and test hypotheses, much as the science and maths curriculum require.
In short data logging offers ways to do core science experiments, such as studying insulating materials; or acceleration of a trolley on a ramp; or electromagnetic induction. But it also offers a strategy to promote good investigative science in schools.
Data Handling:
When you first come to use the technology like this, using the technology to take the science further, using it to quantify differences; to derive data and to model it, may well seem a long step ahead. However, making use of data so conveniently collected, really deserves to happen in mainstream teaching. When you see the need, it will help to know there are data handling packages designed for use with data collected from sensors. One might imagine that a spreadsheet could handle this - however, these data handling packages can take readings at points on a graph; calculate net changes; calculate graph areas; plot a rate of change against time; fit this to a model and more.
|
| File sharing
|
Share and keep files online
|
|
File sharing allows online collaboration(ta). Some services (including Google Drive, Dropbox, Microsoft's SkyDrive, and so on) allow collaborative(tool) document editing - syncronous editing of documents 'in the cloud'. This can be useful for working together on a shared space, and can sometimes be useful even within the same classroom for using documents to orchestrate dialogic teaching(ta) and high quality dialogue(ta). DROPBOX (dropbox.com) is like a web site with folders where you can store and share files(tool). As a result there's less concern about forgetting your memory stick - though it's an idea to use both. If you install an desktop app on your computer desktop or mobile device, the files will synchronise in each place. You will also find a link to your public folder - by emailing that link to students, you have a simple way to share notes(tool) or homework files.
|
| Blogs
|
Get students to categorise their blogs
|
|
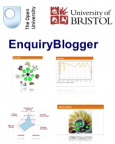
Enquiry blogger is a set of plugins for the blogging(tool) platform WordPress. Users are asked to tag their posts on an inquiry(ta) project, and these tags can be analysed and visualised(ta) to support student progress through their project. Consider a scenario where a class works on their individual blogs(tool) but also use this tool to categorise their posts. Using it they may express how they are doing. The resulting blog displays a diagram to show how many times each category has been used by learners. Colours show which categories are most popular and a click takes the user to those posts. This is a set of plugin tools that can be added to Wordpress. Developed by the Open University Knowledge Media Institute, and University of Bristol’s Centre for Systems Learning & Leadership. Another plugin in this set will generate blogs for a whole cohort. EnquiryBlogger is at http://learningemergence.net/tools/enquiryblogger/
|
| Animation
|
Script a narrative or conversation to explain a topic
|

|
Narrative animation tools afford opportunity to setup questioning(ta) and visualisation(ta) through the use of multimedia. By recording an explanation, teachers can replay it many times in the lesson, observing the students and editing markup on an IWB (see e.g. [1]) for a shared dialogic(ta) space for thinking. First sights of XTRANORMAL (http://www.xtranormal.com/) character animation(tool) tool may deceive that this is for learning languages. However, XTRANORMAL enables students to make narratives(ta) and conversations that explain almost any topic. We have seen it used to handle a question and answer session on student options. Animation is edited on a timeline. Voice can be added by talking or typing.
|
| Social networking
|
Exploit social networking for education
|

|
Social network sites such as facebook can be used to encourage collaboration(ta), sharing and centralisation of artefacts (including, for example blogs(tool)), and inquiry(ta) based learning. If they are setup well, they can become a shared space where pupils can take ownership of their learning. FACEBOOK (www.facebook.com) has been used by teachers to set up a social network(tool) group and connect with students. Facebook is common currency and as such is highly accessible to many - though social network(tool)ing may be rather close to home for others.
|
| Poster
|
Make a multimedia poster
|

|
Creating posters - and especially online multimedia canvases - encourages pupils to select relevant information, and use mathematical thinking(ta)/scientific thinking(ta) and language(ta) to explain an issue. GLOGSTER (http://edu.glogster.com/) is like an onscreen poster(tool) where you can add music, photos, videos to perhaps record an event. The onscreen posters can be published on social sites and more. A teacher account provides a login with class management.
|
| Collaborative
|
Make a questionnaire
|

|
Google Drive can be used as a collaborative(tool) document editor for group work(ta) and collaboration(ta) in class and homework(ta) settings. Google Drive - or similar tools - can also be used to deliver polls(tool) and questionnaires(ta) to pupils in and out of class. If you need to collaborate(tool) or 'co-create' some text, a spreadsheet or a presentation, people with a Google account can edit the same document at the same time. One day, probably yesterday, doing so will be as passé as keeping all your work in the cloud(tool)! However, Google Drive also allows you, or students to make a questionnaire for circulation.
To make an online questionnaire(tool), go to GOOGLE DRIVE (previously Google Docs at drive.google.com) and create a form (instead of creating a document as one might normally). You will find a choice of question types to use, such as multiple choice and free-response answers. Look and you'll find a very useful button for copying a question so that you can edit the copy. When you have finished, the link to the question form is circulated to students, their answers are collated into a spreadsheet that will appear on your Google Drive.
A comparable survey(tool) tool called SURVEYMONKEY (www.surveymonkey.com) is much used for customer feedback. Either of these versatile devices may be used by students to research, poll opinion and more.
|
| Chat
|
Video conference and message using text
|

|
Chat tools provide opportunity for real time collaboration(ta) and dialogue(ta). HALL (hall.com) provides real-time collaboration(tool) one-on-one messaging(tool) and video conferencing(tool) for project teams. This can happen over the web, via their desktop PC or their mobile devices. It is intended as a business tool to provide an always-open window between people who work together remotely. Equally you may know of a learning situation where the need to collaborate is indeed similar.
|
| Animation
|
Tell a story using timeline animation
|

|
Many animation tools can be used to build narrative(ta), and visualisations(ta) of work. These artefacts can act as stimuli for dialogue(ta), dialogic teaching(ta), questioning(ta), and shared reasoning(ta). KERPOOF (http://www.kerpoof.com) allows primary age pupils to make artwork(tool) and timeline(tool) animation(tool). The well-featured animation tool can be used to animate a story.
|
| Questionnaire
|
Ask a question and measure the response
|

|
Poll(tool) tools can be used for quick assessment(ta) or questioning(ta) in and outside of the classroom. They can also be used to allow pupils to give feedback. Using online polls can be useful for assessment outside of class. Within the classroom it can sometimes be useful to allow voting if you have access to ICT to support online methods for: 1) capturing data; 2) many quick questions; 3) private feedback if it's a sensitive topic, or some pupils are reluctant to respond normally; 4) the ability to return to questions, either at a later date, or as discussion points to discuss the answers given. If you need to ask a question(tool) to get feedback “kwiqpoll.com” lets you write a poll question and circulate it as a link to a class. It is so quick to use, there's plenty of opportunity to do so.
|
| Mindmap
|
Plan and make a mindmap
|

|
Mind mapping tools can engage pupils in higher order(ta) reasoning(ta) around the visualisation(ta) of a problem, topic, or subject. Computerised tools often support embedding multimedia into these maps, providing a richer document and potential to engage pupils in creating videos, images, and text around a particular issue and organising these. Teachers could think about what sort of information pupils should include on their maps - keywords, key people, concepts, times, artefacts, etc., and whether or not the maps are used to display their knowledge of a domain (concept mapping) or to build new ideas and evaluation (brain storming). MINDMEISTER (mindmeister.com) is an incredibly easy mind-mapping(tool) tool. It lets you put ideas in boxes and link them together - as one does in concept mapping(tool). A box can contain a picture or a document or a link to a web site. MINDMEISTER might be used to make a ‘poster’ summarising a course. Furthermore, several people can work on the same mindmap at the same time.
|
| Word processing
|
Keep a personal notebook online
|

|
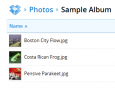
Online writing tools can be used to encourage pupils to engage their subject specific language(ta) to writeup work, share it, and add multimedia. PENZU www.penzu.com offers means to keep an online note(tool)book, and it actually looks much like a paper version, It can be used to keep a personal journal. Photographs can be added, quite straightforward to use and the attractive results may well encourage some students to use it to write up work.
|
| Questionnaire
|
Get feedback from the class during a lesson
|
|
Poll(tool) tools can be used for quick assessment(ta) or questioning(ta) in and outside of the classroom. They can also be used to allow pupils to give feedback. Using online polls can be useful for assessment outside of class. Within the classroom it can sometimes be useful to allow voting if you have access to ICT to support online methods for: 1) capturing data; 2) many quick questions; 3) private feedback if it's a sensitive topic, or some pupils are reluctant to respond normally; 4) the ability to return to questions, either at a later date, or as discussion points to discuss the answers given. POLL EVERYWHERE (polleverywhere.com) replaces physical voting hardware with voting via a web page or SMS texting. It was designed to gather live responses to a TV show but it may work also to gain feedback in teaching situations.
|
| Presentation
|
Make a multimedia presentation that can pan and zoom
|

|
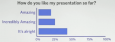
Presentation and poster tools based on canvases can be used to create a less 'linear' visualisation(ta) than a powerpoint, or poster might allow. Different sections of the canvas can be used as you would use 'slides' in a powerpoint, but the relationships between the sections can be indicated more clearly by building connections between the areas, or - on prezi - using the zoom function to 'layer' concepts on top of each other. Because they are online, prezis can be used as a collaborative(ta) tool to facilitate dialogic teaching(ta) and high quality dialogue(ta) around the shared artefact. Prezi is unlike PowerPoint in that your presentation usually 'happens' without even turning a page. It can create presentations(ta) that have incidental flair and some would say are more engaging. You can import Powerpoints and share your work over the web or offer them as a downloadable item.
You can invite students to a screen meeting where they can co-edit a project, add video and pictures. They can 'embed' a presentation in a blog; export to a self-playing file and publicise it using Facebook. Free and premium accounts available.
|
| QR codes
|
Label objects with notes and knowledge
|

|
QR codes can be used to embed links to further information in visualisations(ta), perhaps making use of corridor displays to link to wikipedia pages on current topics. QR CODE GENERATOR allows you to make the 2D patterns most often used in advertising or retailing. A QR code may contain a page of text; a link to a web page or photo or all your contact details. When you have made the code, a mobile device with an app, such as Google Goggles, is used to read it.
You could for example use QR code(tool) patterns to offer information of objects in a display cabinet, or make use of the time pupils spend queuing in the corridor, put a QR code(tool) with useful facts on the classroom door. The gain is that you can get data into a mobile device, and possibly a student too, without typing.
The QR code can get a phone number ready to dial; create a text message; put a date in your diary or show you a place on a map. A link below offers classroom ideas.
|
| Data logging
|
Use sensors to measure and investigate
|

|
Encourage pupils to engage in the scientific method(ta) and reason(ta) about how best to use sensors to collect data for an inquiry(ta) project. Engaging pupils in using tools can encourage them in their use of language(ta) and group work(ta) for a particular problem. Today there are hundreds of objects with sensors that respond to variables such as temperature and light. They enable us to measure force (in our weighing scales); deceleration (in our car air bags) and location (in GPS navigation). Sensors help us to investigate science. If you wonder about the G-forces you might undergo on a theme park ride, or how long it takes to cool a can of Cola, you are in the business of investigating science. Data logging technology now provides students with a tool to operate scientifically, solve problems in technology lessons, or analyse data in maths. All through the 1990's and ever since, UK schools have acquired equipment for measuring using sensors, largely because the National Curriculum (~1990) encouraged teaching science with technology.
Sensors(tool) are obviously tools for measuring in science, but why might they be better than regular tools? Are they more accurate; more convenient or less costly? On these points alone, they are little better than a device such as a thermometer. Sensors and data loggers(tool) are in part ‘special’ because they can display fast changes and measure with precision. A temperature sensor linked to a live graph can give an insight into how a cup of coffee cools. Analysing the data from that experiment provides learning opportunities - which can often be overlooked.
Sensors extend the range of things we can measure - from timing a falling mass to recording human pulse changes during a race. Importantly, a live display of a changing measurement can provide students with a tacit understanding of what is happening. Nearby are numerous examples to evaluate what sensors bring to science.
Technology continually innovates and just sometimes, technology's ability to provide an automatic result is worth reflecting on. An accelerometer(tool) gives an insight into gravity by providing the number 9.8 - a figure for the acceleration caused by gravity. Another sensor, called a light gate(topic), can also measure acceleration but this result needs to be derived from measuring distance and time. Ultimately you have measured the same parameter but the advantage of using a light gate is that students must do the work to get to the answer. And that is very useful indeed. A further example may help: one type of breathing sensor 'integrates' chest movements to display a breathing rate on a screen. Another type of breathing sensor shows a wave of peaks as the chest moves. In the latter case, students need to count the peaks to obtain the breathing rate. An anaesthetist would find a direct readout of breathing rate useful while an engineer would find a direct readout of acceleration useful. A teacher however, would see learning opportunities in getting students to work things out.
|
| Spreadsheets
|
Numbers, graphs and maths
|

|
Spreadsheets can be used to engage pupils in the scientific method(ta) and mathematical thinking(ta), both as a tool to record results, and - through the use of functions and graphing techniques - a higher order(ta) reasoning(ta) device to problem solve and explore the best visualisation(ta) and analysis techniques. Some online tools (including Google Drive) support many of the functions of desktop spreadsheet applications such as Excel, and can thus be used for collaborative(ta) document editing. A spreadsheet(tool) may have found itself in school by accident, but in no time at all, its calculating(tool) and graph(tool) drawing abilities found it a secure place. In science teaching, a spreadsheet is a ready-made results-table that quickly produces a graph. Graphs are a key tool for analysing data and a spreadsheet makes them with ease. In fact, spreadsheets can produce an astounding range of graphs. Our role as science teachers may be to encourage pupils to communicate effectively using graphs.
The ability of spreadsheets to organise, record and analyse data fulfils aspects of exploring science. If you had a table of students’ personal data, you could sort it into order of shoe size, or work out the average size of the class. You could draw a bar chart to see how the shoe sizes vary across the class. Or draw a scattergraph to see if the sizes vary with height. You might also search for those with black hair and see if they have an eye colour in common. Students can similarly use a spreadsheet to sort and search for patterns in the properties of elements in the periodic table
It may be clear already that students using a spreadsheet in these ways have to work scientifically. They would need to define what they want to find out, collect data, organise it and analyse it. A case can be put that the use of a spreadsheet belongs, and probably deserves a place in science teaching.
|
| Chat
|
Use an online study area to support students
|

|
Study Hall is an attempt to combine the best of social networking(tool) and collaborative(tool) document storage and editing. It can be used for collaboration(ta) on documents, structured group work(ta) and dialogue(ta) online, and homework(ta) tasks as well as in class or continuous inquiry(ta) based projects. Study Hall (http://i1.studyhallapp.com) is aimed at education and it allows you to create a virtual study area on the web. You can upload notes(tool) and assignments and support your students via their mobile devices and social networks. The thinking behind this application is that learning is about “thought provoking discussion(ta)s with peers and teachers”. Study Hall provides a means to connect distant people and it is easy to see its role in online tutoring. But take a look to see where else it may be valuable.
|
| Quiz
|
Share a test with a link
|

|
Online test tools provide quick assessment(ta) in class and for homework(ta), with tests automatically marked they can be quickly and easily used as a discussion(ta) point in classrooms for formative feedback. TESTMOZ (www.testmoz.com) allows you to make online tests(tool) with surprisingly little fuss. It offers a choice of question(tool) response types as well as automatic grading based on a mark scheme that you create as you type. A straightforward tool you could use now.
|
| Questionnaire
|
Encourage students to chat in class
|

|
A tool for encouraging synchronous dialogue(ta) and a means for assessment(ta). TodaysMeet.com offers an easy way to gain feedback(tool). You set up a ‘room’ and send everyone the link to it so they can type their comments or engage in ‘chat(tool)’. Todaysmeet can be used at a moment’s notice as seemingly membership is unnecessary. This tool could be used in a lesson to encourage effective dialogue using Ground Rules and in turn assessment.
|
| Iwb
|
Sort objects with an interactive whiteboard
|

|
The Interactive WhiteBoard can be used just as a sophisticated 'flashy' powerpoint delivery tool. It can also be used as a shared space for dialogic teaching(ta), whole class(ta) dialogue(ta), and higher order(ta) questioning(ta) and reasoning(ta). In these cases it is used both to present resources - including multimedia - and to annotate them, both at the initial presentation and later on in the lesson, to return to the same ideas and show the cumulative nature of dialogue and reasoning as 'building up' on each others ideas. Triptico (www.triptico.co.uk) is a desktop application(tool) with some interactive(tool) unique tools for a whiteboard(tool)
For example, there is a way to drag and drop a long list of sentences into order. If the sentences described how to separate salt from salt, you might engage the whole class in sorting them.
Another resource, there are several within, lets you sort pictures. The application is said to very easy to use. For ideas, see the video link below.
|
| Questionnaire
|
Measure students' understanding in real-time
|

|
Poll(tool) tools can be used for quick assessment(ta) or questioning(ta) in and outside of the classroom. They can also be used to allow pupils to give feedback. Understoodit.com is a particular sort of tool which - whether on a PC or mobile - allows students to use an app or webpage to state whether they are confused or not; it can thus be used for 'traffic lighting' understanding. If it’s hard to know whether every student in your class understands you, understoodit.com allows every class member with a PC or a mobile(tool) device to offer feedback(tool). Students use a simple app(tool) or webpage to state whether they are say if they are confused or not. The feedback appears in real-time throughout a lesson, thus the teacher can gauge their effectiveness and instantly adjust the delivery. It also appears to be used for 'taking a register'. See the short informative video at understood.it.
|
| Blogs
|
Questions and discussion around a blog
|

|
Blogs offer a great space for collaborative(ta) writing and language(ta) development. Urtak adds to this by encouraging questioning(ta) on blogs, to engage pupils in reasoning(ta) together and collaborative dialogue(ta). Urtak.com provides a way to solicit comments on blogs(tool). The comment, described as ‘collaborative(tool) polling(tool)’ takes the form of questions which visitors rank as important or not. URTAK is said to offer a way to gain better information from your community, and to typically engage people more than a simple comment box underneath a blog post. You may choose to use such a tool to poll opinion on a science issue. But by allowing questions to be asked in response to questions, Urtak offers an approach to explore.
|
| Video
|
Broadcast live video from school
|

|
Engaging pupils in creating video, and building a narrative(ta) encourages them to think about their language(ta) and explanation skills. They can be used to engage pupils, to revist their explanations, and keep them "on task" through the use of roles and drama(ta) tasks. While USTREAM (www.ustream.tv) looks like youtube - it is both different and done differently. Its edge is to allow live broadcasting(tool) over the net. For this you need little more than a web camera and microphone. Even more remarkably, this 'video streaming' service allows you to broadcast video(i) directly from a mobile device using a iphone application.
Seemingly USTREAM is used by big name broadcasters and home 'lifecasters' alike and is very noticeably supported by advertising. With millions of users, the content is diverse and like all such things, merits a preview before a class dives in. Nevertheless the prospect is that of a school or class having a TV channel to communicate. The USTREAM story is that it was was first used by soldiers to broadcast news back to their families. Short of reporting back from a war zone, your class might broadcast back from your field trip.
|
| Presentations
|
A panoramic presentation with hot-spots
|

|
Vuvox can be used to create a visualisation(ta) of multimedia in a more dynamic way than powerpoint, to interact with a linear visualisation(ta) for example in a timeline. VUVOX (www.vuvox.com) is a tool to make presentations(tool) such as photo collages that display as panoramas(tool) with hot-spots. Imagine VUVOX as a way to make a set of Powerpoint slides that scroll across the screen. You can add a wide range of media and interactivity to the panoramic result.
|
| Poster
|
A multimedia 'wall' for creative, collaborative interaction
|

|
Canvas tools which provide space for organising media - videos, comments, images, etc. - can be useful for creating a visualisation(ta) and collaborative(ta) space for dialogue(ta) on a particular topic. They can be useful for dialogic teaching(ta) - to build on ideas over time, contribute to each other's ideas, and create rich multimedia representations of the shared reasoning(ta) and questioning(ta) over time. WALLWISHER (http://www.wallwisher.com) is a notice board(tool) where you can plan, discuss and brainstorm(tool). Use it to add questions, post-it notes(tool) and add comments(tool). It is easy to sign up and use immediately.
|
| Webdesign
|
A multimedia website project report
|

|
Creating a website is a great way for pupils to take ownership of their learning, think about e-skills and e-safety, and how to explain their ideas to an audience. Websites can provide a space for pupils to reason(ta) about a problem and share their ideas in a collaborative(ta) setting, while engaging their language(ta) skills. WEEBLY (education.weebly.com) is a way for a class to make a project website(tool). Students have various ways to add multimedia to their sites which may help them express themselves. This happens on the web site, which firstly eases many technicalities to do with web publishing. Secondly, since Weebly allows students to work from home, as cosmetic adjusting of web sites would while away class time.
The education section of this tool allows students to work inside a protected portal away from the public internet. Having a safe space, under teacher control, where they can include pictures (an e-safety issue) is often advised.
|
| Webdesign
|
Share knowledge; share the load of sharing it
|

|
Encourage your pupils to collaborate(tool) and engage in peer assessment(ta) by editing each other's work WIKISPACES (www.wikispaces.com) allows you to make a website like Wikipedia. The wiki 'concept' is core to sharing knowledge. You can write your own information pages and that doesn't mean writing a whole encyclopaedia. Unlike writing a blog post, where you would see people's opinions in a list below, what you type into a 'wiki' can be rewritten by others and edited mercilessly. (And that can be a measure of something very good going on in a class).
Your choice of topic could be as wide as providing notes for an entire course or providing a space for the class to record experience of a field trip. The general idea is the last person to edit a page thinks they've the last word - which may take some getting used to. 'Wiki-bullying' could happen, but with that in mind, you could encourage your pupils to collaborate(tool) by editing each other's work and so engage in peer assessment(ta). Incidentally, to help that collaboration, there are ways to have more than one person edit a page at once.
|
| Questionnaire
|
Get feedback and involve the audience
|

|
A way to facilitate checking the students' response (known as traffic lighting) as well as peer assessment(ta)/questioning(ta) during presentation sessions, either by the teacher or students. The back-channel is a term to describe what the class might be saying or thinking during a lesson. “backchan.nl” offers a way let the audience of presentations(ta) comment or ask questions(ta)/polls(tool). They could also be voting(tool) on the importance each other's questions - which is a great opportunity if you've ever wished a question and answer session to end. The voting then allows the presenter to prioritise questions that merit answering. As well as know what is going on in the 'back channel', this tool is claimed to make better use of that Q & A time. You might use it while showing a video, or dare to use it while talking at length to the class. But here you also have a means to encourage pupils to actually ask questions, and furthermore, have them think about each other's questions.
|
