Tools/Data logging
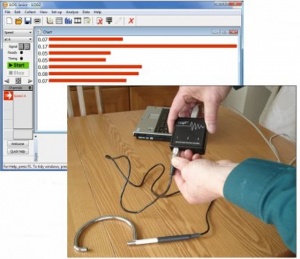
Tool Description Data logging is the process of recording measurements from sensors. A weather station pretty well fits this definition. The station captures readings from sensing devices and it may also display what is happening right now. The station offers a better way to study the world. While many people would say that measuring with technology is more accurate; more modern or 'the way to go', the real benefits are the important advantages for learning. Some are less than obvious:
- You can monitor extremely fast or tediously slow events. Thus you can now investigate a whole range of things you would have needed to overlook.
- You can design and make equipment to solve problems for 'technology or D&T' projects.
- You can measure tiny changes with precision - for example to find out whether wearing white clothes could offer comfort on a hot day. The measured difference between black and white clothes is slight, by the way.
- You can see results appear live and immediately, get a tacit understanding for what’s happening. This incidentally lets you modify your experiment when you see readings going awry.
- You can gain data to analyse, evaluate and test hypotheses, much as the science and maths curriculum require.
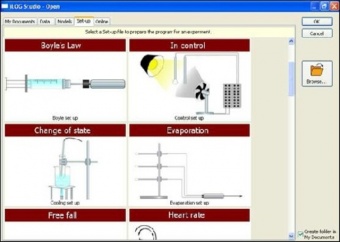
In short data logging offers ways to do core science experiments, such as studying insulating materials; or acceleration of a trolley on a ramp; or electromagnetic induction. But it also offers a strategy to promote good investigative science in schools.
Data Handling:
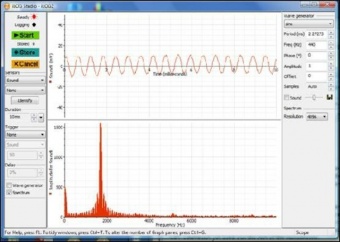
When you first come to use the technology like this, using the technology to take the science further, using it to quantify differences; to derive data and to model it, may well seem a long step ahead. However, making use of data so conveniently collected, really deserves to happen in mainstream teaching. When you see the need, it will help to know there are data handling packages designed for use with data collected from sensors. One might imagine that a spreadsheet could handle this - however, these data handling packages can take readings at points on a graph; calculate net changes; calculate graph areas; plot a rate of change against time; fit this to a model and more. (edit)Data logging is the process of recording measurements from sensors. A weather station pretty well fits this definition. The station captures readings from sensing devices and it may also display what is happening right now. The station offers such a better way to study the world. While many people would say that measuring with technology is more accurate; more modern or 'the way to go', the real benefits are the important advantages for learning. Some are less than obvious:
- You can monitor extremely fast or tediously slow events. Thus you can now investigate a whole range of things you would have needed to overlook.
- You can design and make equipment to solve problems for 'technology or D&T' projects.
- You can measure tiny changes with precision - for example to find out whether wearing white clothes could offer comfort on a hot day. The measured difference between black and white clothes is slight, by the way.
- You can see results appear live and immediately, get a tacit understanding for what’s happening. This incidentally lets you modify your experiment when you see readings going awry.
- You can gain data to analyse, evaluate and test hypotheses, much as the science and maths curriculum require.
In short data logging offers ways to do core science experiments, such as study insulating materials; or acceleration of a trolley on a ramp; or electromagnetic induction. But it also offers a strategy to have good investigative science happen in schools.
Data Handling:
When you first come to use the technology like this, using the technology to take the science further, using it to quantify differences; to derive data and to model it, may well seem a long step ahead. However, making use of data so expensively collected, really deserves to happen in mainstream teaching. When you see the need, it will help to know there are data handling packages designed for use with data collected from sensors. One might imagine that a spreadsheet could handle this - however, these data handling packages can take readings at points on a graph; calculate net changes; calculate graph areas; plot a rate of change against time; fit this to a model and more.
Teaching Approach. Data logging tools provide opportunity to engage pupils in the scientific method(ta) and higher order(ta) reasoning(ta) and problem solving over data collection and analysis. They can be used collaboratively(ta) or individually in inquiry(ta) based learning. (edit)
| Tool details | |
| Title | Data logging and data handling |
| Topic | [[Topics/Data logging|Data logging]] |
| Licence / Cost / Platform | Needs equipment |
| Subject / Categories | ToolInfo, Data logging, ICT |
| Teaching Ideas / Links | Most UK school science departments own a quantity of data logging sensors. How often it’s used varies from little to several occasions per year. |
| Link | Link to software, developed at the University of Leicester, and made to work across the many different manufacturers hardware http://www.insightresources.co.uk |


