The printable version is no longer supported and may have rendering errors. Please update your browser bookmarks and please use the default browser print function instead.
| Subject
|
Science
|
| Activity Name
|
Variation of human characteristics
|
| Learning Objectives
|
- For students to understand that there is a variation in some human characteristics
- For students to collect, present, visualise and analyse variation data for themselves and the class
|
| Outline of activity
|
- Students measure various quantities (including but not limited to; arm length, height, hand span) and then analyse this data to look for patters of distribution amongst the class
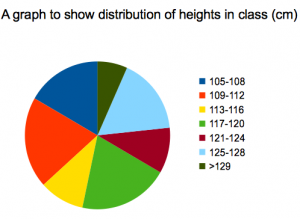
- The spreadsheet allows graphs showing the data to be drawn instantaneously as the data is inputted helping student visualise the variation/distribution of the data within the class
|
| Technology requirements and skills
|
Computer with spreadsheet software and template file (File:Class Data Set.ods).
|
| Equipment requirements
|
- Rulers or measuring tapes. For height and other length measurements if tapes/rulers are limited then a single measuring station (for example marked on wall) could be used for the whole class
- Paint/paper for handprints or drawing around hand (their own or each others)
- Mini white boards could be used to engage class predictions of possible distributions (most common length, highest value, lowest value, etc)
|
| Possible extension or supplementary activities
|
- Data sets for other classes (or indeed the whole school) could be collected and students could see if the patterns/distributions seen in one class were similar/different to others
- Calculators could be used to work out averages and other data analysis as an alternative, see moving stones activity for examples
- Some students may analyse the data further, calculating the mean, mode, median of the data set (see counting stones activity for more suggestions and instructions)
|
| Suggestions of what ‘successful’ student understanding or work might look like
|
- Students will be confident collecting and handling data sets
- Students will be familiar with the idea that certain human characteristics have a range (and distribution) distribution of values within a group
|

