Wiki text of an Idea for a teaching strategy
Idea for a teaching strategy based on a class of 30 students
Set up three 'measuring' work stations(one for each continuous variable: height, hand span and arm length) with space and materials for 3 groups of 3-4 around each station. Each pupil is to be given a personal data slip that they must complete whilst working in groups of 3-4.
The data slip could be something simple like this:
Name:_________________________
Height (cm):__________________
Hand span (cm):_______________
Arm length (cm):______________
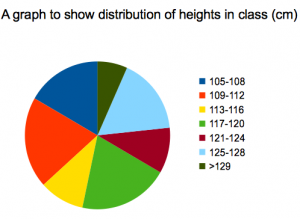
Pupils collect data - they could enter the data directly into a class spreadsheet projected on to a white board. As each set of three groups finishes at their station, each pupil should make sure that they have their personal data completed on their data slip before moving to the next station. Groups circulate through all three stations helping each other to make accurate measurements.
Data could be collected in one lesson and analysed in a further lesson. This gives the teacher time to set up the range fields on the spreadsheet based on the data collected.
Possible Extension Activities
- Data sets for other classes (or indeed the whole school) could be collected and students could see if the patterns/distributions seen in one class were similar/different to others.
- Calculators could be used to work out averages and other data analysis as an alternative, see moving stones activity for examples.
- Some students may analyse the data further, calculating the mean, mode, median of the data set (see counting stones activity for more suggestions and instructions).
Extension/enrichment activities: hand span measurement could be used to measure arm length/hand (see professional development PDF below) could be drawn around on square paper and the area worked out and compared with hand span to look for patterns/data could be analysed by sex, age, to look for patterns also pattern spotting between variables.
- The Witch's Hat is a fun drama lesson plan to introduce measuring in cm. (av. rating 4.7/5 out of 12 ratings on TES) http://www.tes.co.uk/teaching-resource/MATHS-DRAMA-LESSON-THE-WITCH-S-HAT-6013315/review/1/.
- Photo and info for measuring hand span: http://www.topendsports.com/testing/tests/hand-span.htm.
- Great professional development PDF explaining in detail a lesson on using hand spans to measure arm length: http://www.mathsolutions.com/documents/0-941355-42-X_L2.pdf.

