Data Logging and Control/Cooling Curve
Cooling curve
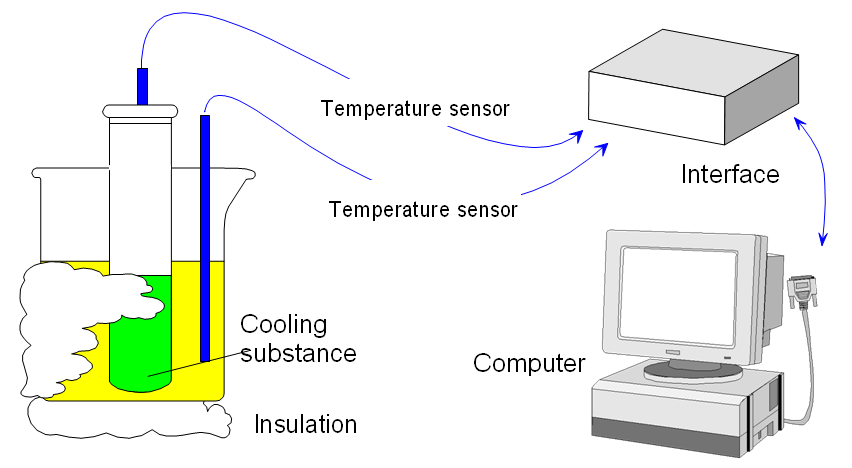
Two temperature sensors can collect some interesting information about cooling during a change of state. In this experiment the temperature of a water bath increases as a substance cools. But the unusual setup here will also show that, during the change of state, heat is lost from the substance even though its temperature remains constant.
Apparatus
Beaker, test tube, water bath, insulation material for the beaker, stearic acid (or wax; benzophenone), test tube rack, interface, Temperature sensors (not First Sense types - they might be damaged).
Setting up Connect two temperature sensors to sockets 1 and 2 on the interface.
Place one temperature probe in a test tube half-filled with Stearic Acid. Warm the tube and probe in a water bath to melt the stearic acid.
Some systems recognise the sensors you attach automatically, in others you do this yourself. If the sensors are adjustable, set them on a 0-100 range.
Recording the data Remove the tube from the water bath. Place it in a small insulated beaker, partly filled with water. Record for 10 minutes. Stir the stearic acid continuously.
Using the results
- How does the graph show you that the stearic acid is getting cooler?
- What is happening to the water temperature as this occurs? Why is this?
- What is happening to the stearic acid when the graph is flatter?
- What happening to the water temperature as this occurs? Where does the water gain its heat from?

