Visualising data: Difference between revisions
SimonKnight (talk | contribs) No edit summary |
JanetBlair (talk | contribs) No edit summary |
||
| (24 intermediate revisions by 5 users not shown) | |||
| Line 1: | Line 1: | ||
[[Category:Science]][[Category:Primary]] | [[Category:Science]][[Category:Primary]] | ||
{{Rinfo | {{Rinfo | ||
|title= Variation of human characteristics | |type= Lesson idea | ||
|attribution={{James de Winter}} | |||
|final=yes | |||
|title= Variation of human characteristics - Visualising Class data | |||
|subject=Science | |subject=Science | ||
|topic= | |topic=Graph | ||
|tagline=A big survey of ourselves, measuring hands, feet and more | |||
|image=SC0012_screenshot.png | |||
|resourcenumber= SC0012 | |resourcenumber= SC0012 | ||
|age= Primary | |age= KS1, Primary | ||
|content= Students measure | |content= Students measure themselves (including but not limited to; arm length, height, hand span) and then analyse their data to look for patterns of distribution amongst the class. A spreadsheet allows graphs showing the data to be drawn instantaneously as the data is input - helping students to visualise the variation and distribution of the data within the class. | ||
|format= | |format= | ||
|Learning Objectives = | |Learning Objectives = | ||
* | * Uunderstand that there is a variation in some human characteristics. | ||
* | * Collect, present, visualise and analyse variation data for themselves and the class. | ||
|strategy= | |strategy= | ||
|additional resources= | |additional resources= | ||
* You will need to | * You will need to use spreadsheets (see below). | ||
* Rulers or measuring tapes. For height and other length measurements if tapes/rulers are limited then a single measuring station (for example marked on wall) could be used for the whole class | * Rulers or measuring tapes. For height and other length measurements if tapes/rulers are limited then a single measuring station (for example marked on wall) could be used for the whole class. | ||
* Paint | * Paint and paper for hand prints or drawing around their own or each other's hand. | ||
* Mini white boards could be used to engage class predictions of possible distributions (most common length, highest value, lowest value | * Mini white boards could be used to engage class predictions of possible distributions (most common length, highest value, lowest value and so on) | ||
|useful information= National Curriculum reference: [http://www.education.gov.uk/schools/teachingandlearning/curriculum/primary/b00199179/science/ks1/sc2 KS1, Sc1 2h], [http://www.education.gov.uk/schools/teachingandlearning/curriculum/primary/b00199179/science/ks1/sc2 KS1, Sc2 4a.] | |useful information= National Curriculum reference: [http://www.education.gov.uk/schools/teachingandlearning/curriculum/primary/b00199179/science/ks1/sc2 KS1, Sc1 2h], [http://www.education.gov.uk/schools/teachingandlearning/curriculum/primary/b00199179/science/ks1/sc2 KS1, Sc2 4a.] | ||
|related resources= | |related resources= | ||
| Line 24: | Line 31: | ||
|resources= | |resources= | ||
*[[Wiki text of an Idea for a teaching strategy]] | |||
* Template [[file:Class Data Set.xls]] in excel | * Template [[file:Class Data Set.xls]] in excel | ||
* And in ODS format [[file:Class Data Set.ods]] | * And in ODS format [[file:Class Data Set.ods]] | ||
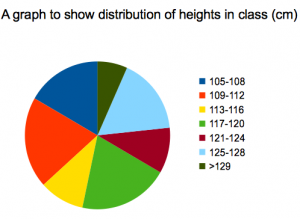
Both files will automatically update the pie chart for data. | * Both files will automatically update the pie chart for data. You can add as many children as you like, and you can change the ranges given in the tables. You cannot add or remove rows - the number of intervals should stay the same. You can change the data being visualised by using the 'drop down' menu on the Excel sheet. | ||
[[File:SC0012_screenshot.png|350px|none|alt=Graph of collected data.]]}} | |||
Latest revision as of 15:21, 3 October 2012
Lesson idea. Students measure themselves (including but not limited to; arm length, height, hand span) and then analyse their data to look for patterns of distribution amongst the class. A spreadsheet allows graphs showing the data to be drawn instantaneously as the data is input - helping students to visualise the variation and distribution of the data within the class.
Teaching approach. The lesson offers the opportunity to explore measurement, relationships between measurement, and ways to visualise and summarise this data. The use of ICT(i) allows the teacher to enter data and for pupils to immediately see the impact this has on the pie chart and frequency tables (which are automatically updated). This also allows the teacher to change the 'range' for the frequency counts, and discuss with pupils the impact of this on the pie chart, and whether this is a good representation - encouraging the use of mathematical language(ta) and scientific method(ta) throughout. In collecting the data pupils have opportunity for some self-directed group work(ta) - to measure various lengths as described below - and the teacher could use whole class(ta) questions(ta) to explore the strategies taken to conduct this investigation(ta). (edit)
| Resource details | |
| Title | Variation of human characteristics - Visualising Class data |
| Topic | [[Topics/Graph|Graph]] |
| Teaching approach | [[Teaching Approaches/Investigation|Investigation]], [[Teaching Approaches/Questioning|Questioning]], [[Teaching Approaches/Whole class|Whole class]], [[Teaching Approaches/Language|Language]], [[Teaching Approaches/Group work|Group work]], [[Teaching Approaches/Scientific method|Scientific method]] |
| Learning Objectives |
|
| Subject | [[Resources/Science|Science]] |
| Age of students / grade | [[Resources/Primary|Primary]], [[Resources/KS1|KS1]] |
| Additional Resources/material needed |
|
| Useful information | National Curriculum reference: KS1, Sc1 2h, KS1, Sc2 4a.
|
| Files and resources to view and download |
|


