Monitoring Temperature: Difference between revisions
SimonKnight (talk | contribs) (Created page with "{{draft}} Category:ScienceCategory:Primary {{Rinfo |title= Monitoring Temperature |subject= science |topic= measurement, temperature |resourcenumber= SC0027 |age= pri...") |
m (subjects, ages, types) |
||
| (7 intermediate revisions by 3 users not shown) | |||
| Line 1: | Line 1: | ||
{{ | [[Category:Science]][[Category:Primary]][[Category:ICT]] | ||
{{Rinfo | |||
|type= Lesson idea | |||
|title= Monitoring Temperature - Day and Night | |||
|final=yes | |||
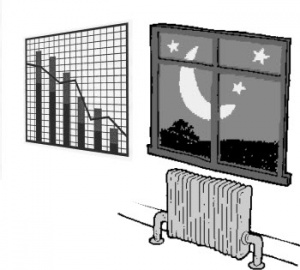
| | |image=Monitoring - What happens whenimnothere0.JPG | ||
|subject= | |tagline=What happens to the room's temperature when I'm not here? | ||
|topic= | |subject=Science | ||
|topic= Measuring | |||
|resourcenumber= SC0027 | |resourcenumber= SC0027 | ||
|age= | |age= age 7-11, Primary | ||
|content= | |content=This activity would follow previous experience of using a temperature sensor to record over time. The teacher asks the class to predict what happens to the room temperature outside school hours. The replies may be used to allow groups to sketch the prediction as a line graph, pin these to the board and discuss when results are available. One student might do this holding a pen while another pulls a paper sheet to their left. Following these predictions, a Data Harvest data logger is set to record over a weekend for example. The class discussion continues when the results have been recorded. | ||
|format= | |format= A three-page teacher's guide with questions to ask about the vocabulary of graphs. | ||
|Learning Objectives = | |Learning Objectives = | ||
* Understand that the sun is a source of heat as well as a source of light | * Understand that the sun is a source of heat as well as a source of light. | ||
* Be aware that colours absorb heat (radiation) at different rates | * Be aware that colours absorb heat (radiation) at different rates. | ||
* Know how a line graph displays results. | |||
|strategy= | |strategy= | ||
|additional resources= | |additional resources=This activity requires a temperature sensor and a large display to discuss the temperature changes the next day and was written around temperature sensing equipment made by Data Harvest UK. | ||
|useful information= | |useful information= | ||
|related resources= | |related resources=Book of activities using sensors [[Primary_Science_Curriculum_Activities_with_Sensors]] | ||
|other= | |other= | ||
|resources= [[file:Monitoring Temperature.doc]] | |resources= | ||
* Read and use now: [[File:Monitoring - What happens whenimnothere - web.pdf]] | |||
* For OCR [[file:Monitoring - What happens whenimnothere.pdf|High res to use for OCR]] | |||
<!--- FILE NOT FOUND * N/A [[file:Monitoring Temperature.doc]] --> | |||
}} | }} | ||
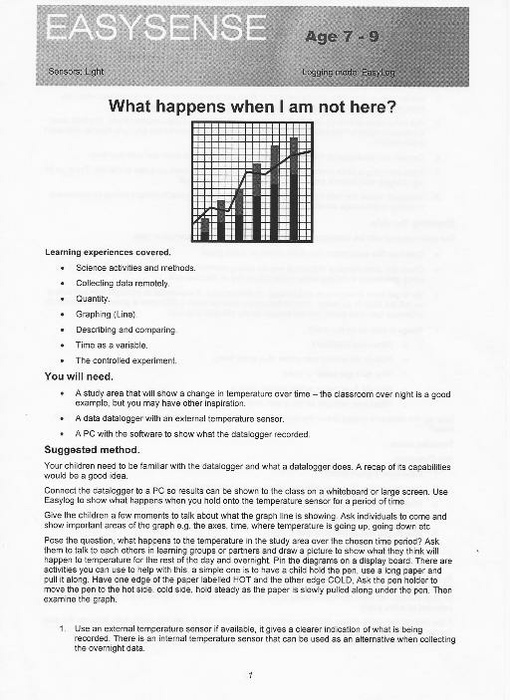
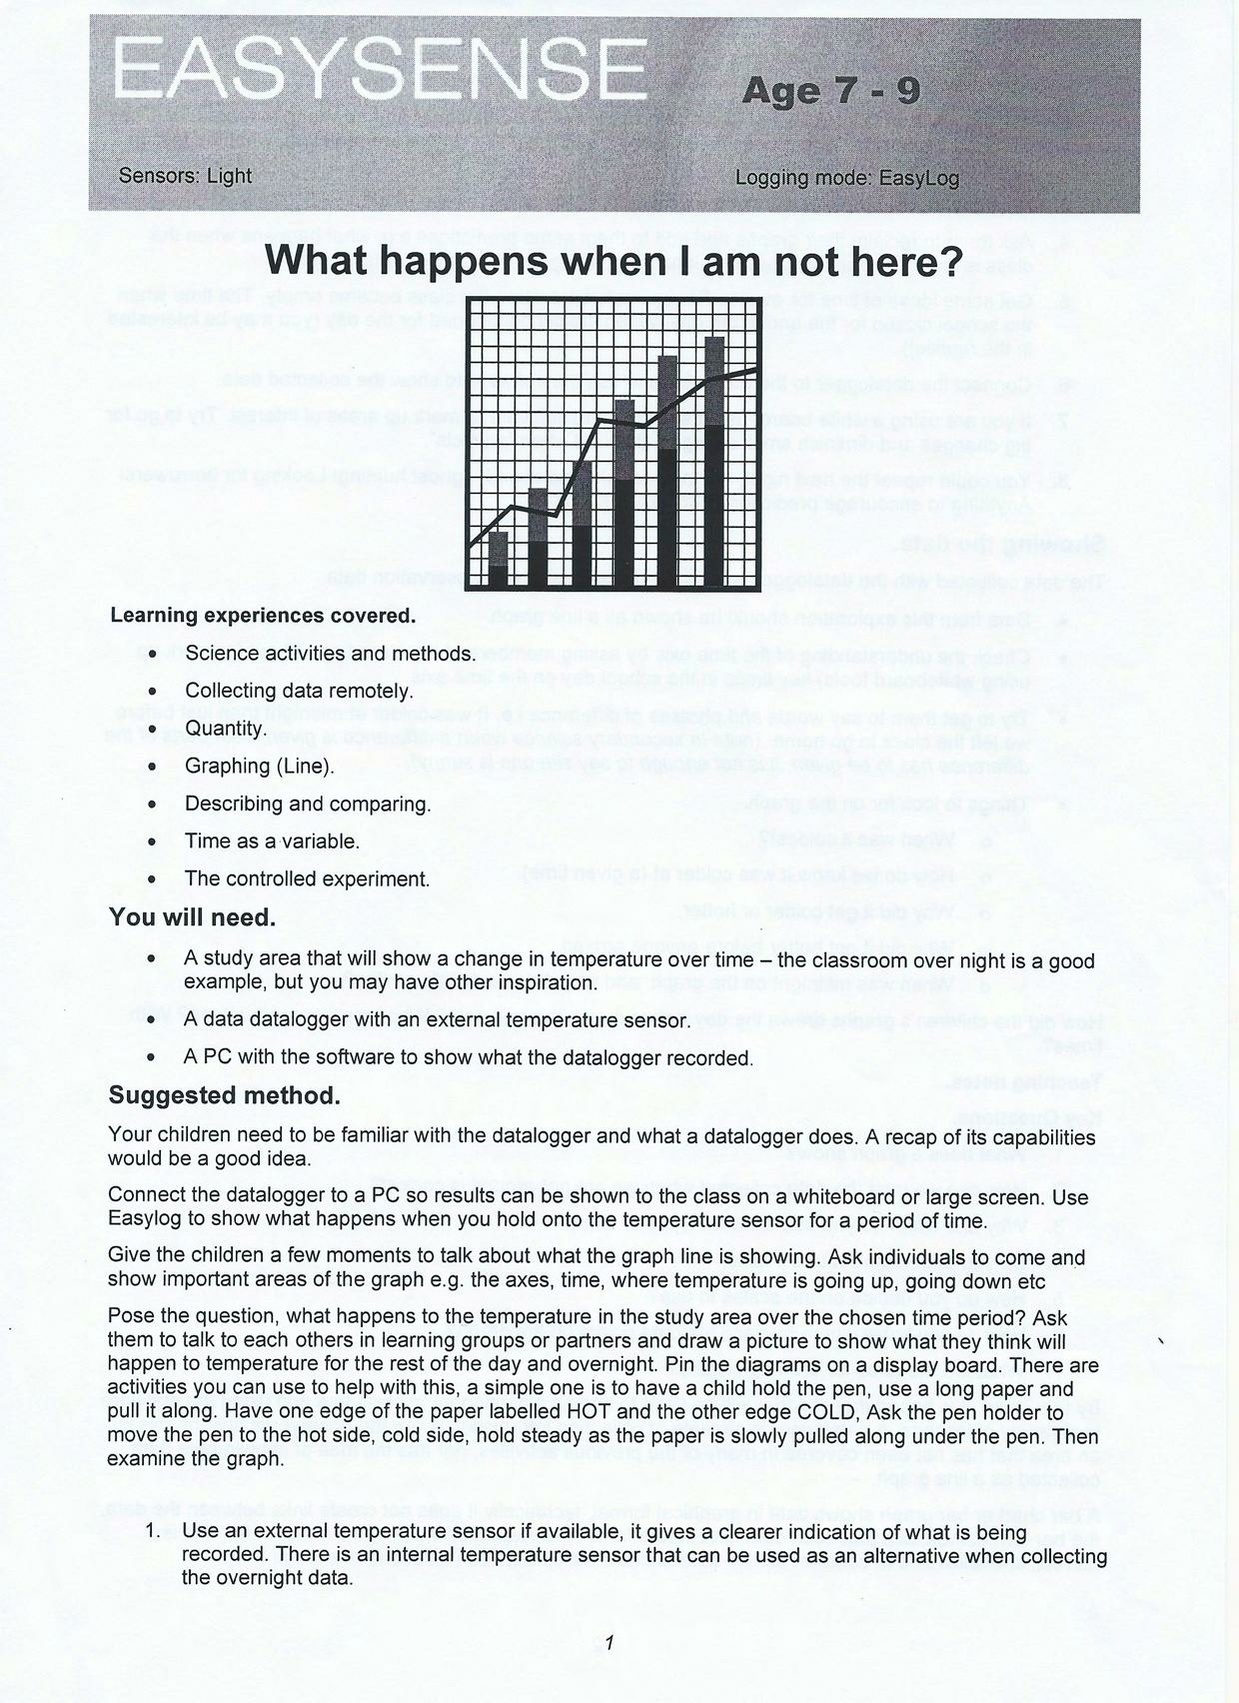
[[File:Monitoring - What happens whenimnothere1.JPG|border|340x340px| | Preview snapshot ]] [[File:Monitoring - What happens whenimnothere2.JPG|border|340x340px| | Preview snapshot ]] [[File:Monitoring - What happens whenimnothere3.JPG|border|340x340px| | Preview snapshot ]] | |||
Latest revision as of 15:34, 28 September 2012
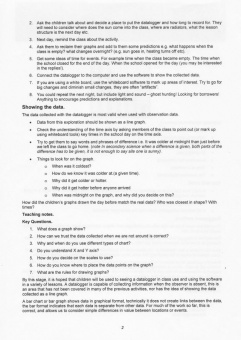
Lesson idea. This activity would follow previous experience of using a temperature sensor to record over time. The teacher asks the class to predict what happens to the room temperature outside school hours. The replies may be used to allow groups to sketch the prediction as a line graph, pin these to the board and discuss when results are available. One student might do this holding a pen while another pulls a paper sheet to their left. Following these predictions, a Data Harvest data logger is set to record over a weekend for example. The class discussion continues when the results have been recorded.
Teaching approach. This lesson involves the use of higher order questioning(ta) on scientific method(ta) topics to engage pupils in an inquiry(ta) relating to recording temperature and the use of sensors. (edit)
| Resource details | |
| Title | Monitoring Temperature - Day and Night |
| Topic | [[Topics/Measuring|Measuring]] |
| Teaching approach | [[Teaching Approaches/Questioning|Questioning]], [[Teaching Approaches/Inquiry|Inquiry]], [[Teaching Approaches/Scientific method|Scientific method]] |
| Learning Objectives |
|
| Format / structure | A three-page teacher's guide with questions to ask about the vocabulary of graphs. |
| Subject | [[Resources/Science|Science]] |
| Age of students / grade | [[Resources/Primary|Primary]], [[Resources/Age 7-11|Age 7-11]] |
| Additional Resources/material needed | This activity requires a temperature sensor and a large display to discuss the temperature changes the next day and was written around temperature sensing equipment made by Data Harvest UK. |
| Related ORBIT Wiki Resources | Book of activities using sensors Primary_Science_Curriculum_Activities_with_Sensors |
| Files and resources to view and download |
|
