Radioactive Decay and Carbon Dating: Difference between revisions
SimonKnight (talk | contribs) No edit summary |
TonyHoughton (talk | contribs) No edit summary |
||
| Line 15: | Line 15: | ||
|licence= | |licence= | ||
|format= wiki page with downloadable .doc version | |format= wiki page with downloadable .doc version | ||
|related resources=This activity was a result of the [[ | |related resources=This activity was a result of the [[GeoGebraSTEM_exploration_day|GeoGebra STEM Exploration]] umbrella activity which asked students to develop 'real world' GeoGebra mathematical modeling applications which reach out to a wide range of users both students and teachers. It is described in their own words. | ||
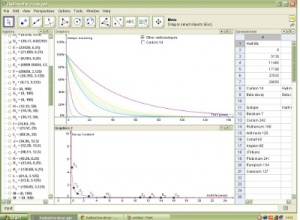
|resources=This is the accompanying GeoGebra application. It was produced by students and can be used to further stimulate new students: | |resources=This is the accompanying GeoGebra application. It was produced by students and can be used to further stimulate new students: | ||
*[[file:Radioactive decay.ggb]] | *[[file:Radioactive decay.ggb]] | ||
}} | }} | ||
Revision as of 16:09, 25 September 2012
Lesson idea. This project explores exponential graphs and how these are applied in radioactive decay, including carbon dating. For those studying for their GCSEs, it would be appropriate to explore radioactive decay theory and how this forms the basis of carbon dating, including topics such as half-lives and what radioactivity is. This knowledge can be further applied into the processes inside a nuclear reactor; perhaps a student could develop this project by drawing graphs of the amounts of energy released by different radioisotopes when bombarded with a neutron in a nuclear reactor. Learning about exponential graphs would also deepen a student’s understanding of compound interest, which is part of the Maths curriculum and in preparation for A-level Maths.
Teaching approach. This lesson features a ‘real life’ example for students to explore using visualisation(ta) via GeoGebra. The focus on ‘real life’ increases student motivation.
The activity engages pupils in group talk(ta), mathematical thinking(ta) and vocabulary(ta). This open ended(ta) task encourages higher order(ta) thinking, and encourages whole class(ta) discussion(ta)/questioning(ta) and inquiry(ta) projects. (edit)
| Resource details | |
| Title | Radioactive Decay and Carbon Dating |
| Topic | |
| Teaching approach | |
| Learning Objectives | By the end of the activity students should be able to understand how a mathematical software modelling and visualisation tool such as GeoGebra can be used to explore 'real life' mathematics. |
| Format / structure | wiki page with downloadable .doc version |
| Subject | |
| Age of students / grade | |
| Table of contents | |
| Additional Resources/material needed | |
| Useful information | |
| Related ORBIT Wiki Resources | This activity was a result of the GeoGebra STEM Exploration umbrella activity which asked students to develop 'real world' GeoGebra mathematical modeling applications which reach out to a wide range of users both students and teachers. It is described in their own words. |
| Other (e.g. time frame) | |
| Files and resources to view and download | This is the accompanying GeoGebra application. It was produced by students and can be used to further stimulate new students: |
| Acknowledgement | |
| License | |

