Tools/Toolroom
This is a holding page for our tools - CUT and paste into new document to move them, once this page is emptied, it will be repopulated from the Category:Tools As I go along I'm transcluding some of these back in.
ICT tools – what achieves your objectives?
Think about what you want your students to get out of ICT.
Just a few years back, software tools were stored on your computer but today you can find similar tools online. The tools offer the added value of giving your work an audience, getting feedback, sharing and improving it. Somewhere in the process, you can imagine that learning does happen. There is surely a resource in this list that will help you achieve your objectives. Several will chime with some teachers and not others.
We've provided a little guidance on how you might use some tools, or tagged them with ideas on how they may work. ICT is often not about what the tool can do, but what you do with the tool. For example, Google Drive enables you to share files but you could get students using it to engage in shared real time research. It then becomes a sophisticated tool to collaborate with. Weigh up a focused use, besides a 'hope for the best' use. Don't weigh up quality with hardware and features. At times you might let students choose their own tools.
Of all the words we’ve available to describe these tools, you ought notice that some are entirely absent. The words are enjoyable, cool, innovative and new way to learn. The key words are to do with what achieves teaching objectives. So do experiment, and even return here to share a use that enhances what we aim to do.
Pedagogy and ICT - A Review of the Literature
The Pedagogy and ICT a Review of the Literature article (Loveless, 2009; published by BECTA) covers the relationship between pedagogy and ICT use. This review attempts to offer frameworks for thinking about the ‘What?’, ‘How?' and 'Why?’ questions of teaching with information and communications technologies (ICT), offering a range of tools to help us to understand our teaching in local and global contexts, to help us, as Freire urged, to ‘read the world’ of our practice (Freire and Macedo, 1987). It covers a range of approaches to pedagogy, relating these to ICT and some particular issues raised in the literature (Adapted from Pedagogy and ICT a Review of the Literature, section Introduction).
ICT tools to gain feedback
Polls and surveys and assessment
Tool Description Tools/Toolroom/description (edit)
Teaching Approach. Tools/Toolroom/teaching approach (edit)
| Tool details | |
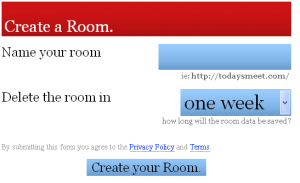
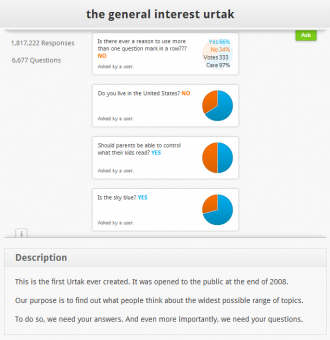
| Title | Encourage students to chat in class |
| Topic | |
| Licence / Cost / Platform | Web tool, ready for use |
| Subject / Categories | |
| Teaching Ideas / Links | |
| Link | |
Tool Description Tools/Toolroom/description (edit)
Teaching Approach. Tools/Toolroom/teaching approach (edit)
| Tool details | |
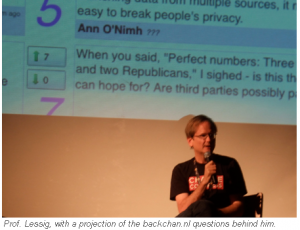
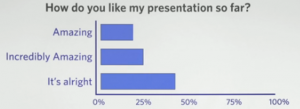
| Title | Get feedback and involve the audience |
| Topic | |
| Licence / Cost / Platform | This web tool is an Open Source(tool) project at MIT. |
| Subject / Categories | |
| Teaching Ideas / Links | |
| Link | |
Tool Description Tools/Toolroom/description (edit)
Teaching Approach. Tools/Toolroom/teaching approach (edit)
| Tool details | |
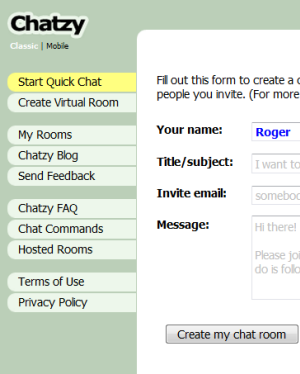
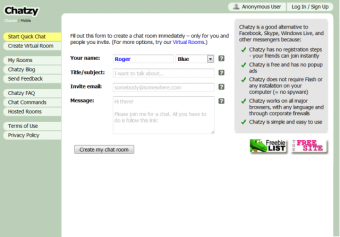
| Title | Talk with your students in an online chatroom |
| Topic | |
| Licence / Cost / Platform | Online Tool |
| Subject / Categories | |
| Teaching Ideas / Links | |
| Link | |
Tool Description Tools/Toolroom/description (edit)
Teaching Approach. Tools/Toolroom/teaching approach (edit)
| Tool details | |
| Title | Questions and discussion around a blog |
| Topic | |
| Licence / Cost / Platform | |
| Subject / Categories | |
| Teaching Ideas / Links | |
| Link | |
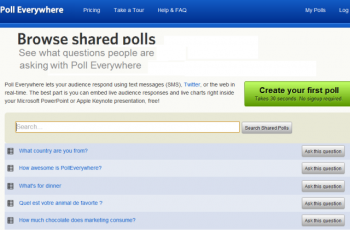
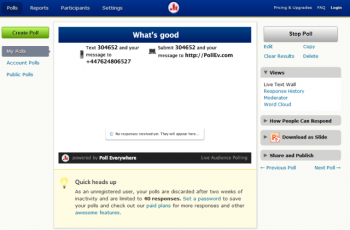
Find out who understands as you teach - UNDERSTOODIT.COM or POLLEVERYWHERE
Tool Description Tools/Toolroom/description (edit)
Teaching Approach. Tools/Toolroom/teaching approach (edit)
| Tool details | |
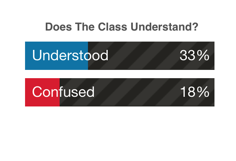
| Title | Measure students' understanding in real-time |
| Topic | |
| Licence / Cost / Platform | Free for students, $3 a month for educators. Students use a web browser link or an app to respond. |
| Subject / Categories | |
| Teaching Ideas / Links | |
| Link | www.understoodit.com |
Tool Description Tools/Toolroom/description (edit)
Teaching Approach. Tools/Toolroom/teaching approach (edit)
| Tool details | |
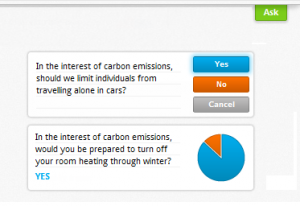
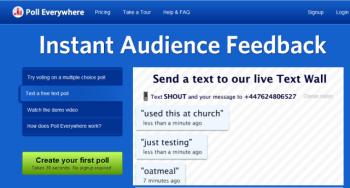
| Title | Get feedback from the class during a lesson |
| Topic | |
| Licence / Cost / Platform | Web tool, free for small groups to use then rising in cost |
| Subject / Categories | |
| Teaching Ideas / Links | |
| Link | www.polleverywhere.com |
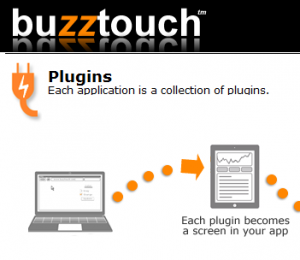
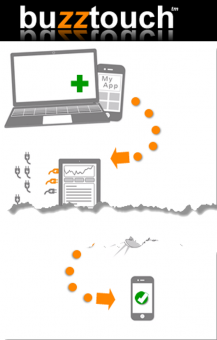
Write apps for iPhone, iPad, and Android at BUZZTOUCH
Tool Description Tools/Toolroom/description (edit)
Teaching Approach. Tools/Toolroom/teaching approach (edit)
| Tool details | |
| Title | Write an app for any mobile device |
| Topic | |
| Licence / Cost / Platform | Create iphone, ipad and android apps |
| Subject / Categories | |
| Teaching Ideas / Links | |
| Link | www.buzztouch.com |
make an online questionnaire at GOOGLE DRIVE
Tool Description Tools/Toolroom/description (edit)
Teaching Approach. Tools/Toolroom/teaching approach (edit)
| Tool details | |
| Title | Make a questionnaire |
| Topic | |
| Licence / Cost / Platform | Online tool requires a Google account. The form tools are very flexible, it's free. |
| Subject / Categories | |
| Teaching Ideas / Links | |
| Link | To create forms see http://www.google.com/google-d-s/forms/, for general guidance https://drive.google.com/start#home |
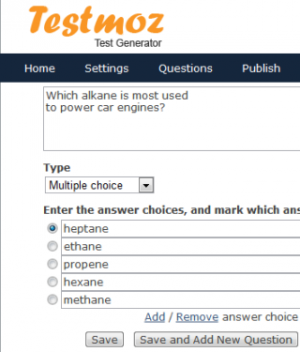
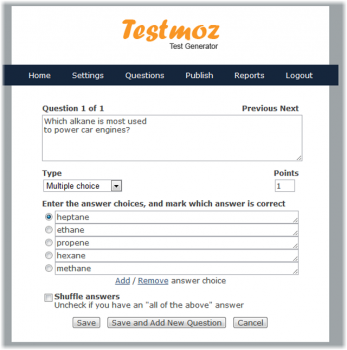
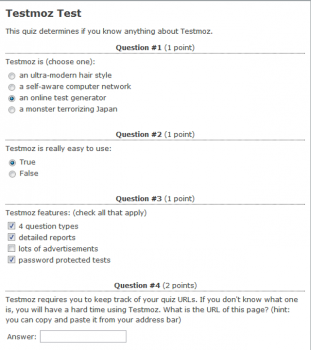
Make an online test TESTMOZ (testmoz.com)
Tool Description Tools/Toolroom/description (edit)
Teaching Approach. Tools/Toolroom/teaching approach (edit)
| Tool details | |
| Title | Share a test with a link |
| Topic | |
| Licence / Cost / Platform | Ready to use |
| Subject / Categories | |
| Teaching Ideas / Links | |
| Link | www.testmoz.com/ |
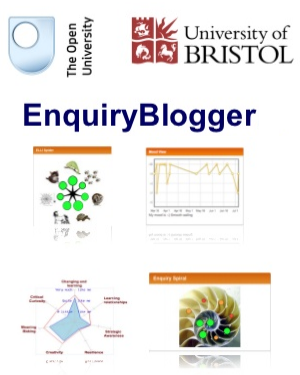
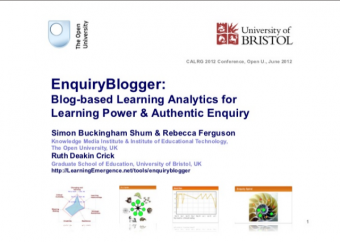
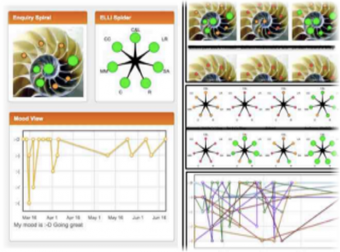
Categorise blog entries - Enquiry(i)Blogger for Wordpress
Tool Description Tools/Toolroom/description (edit)
Teaching Approach. Tools/Toolroom/teaching approach (edit)
| Tool details | |
| Title | Get students to categorise their blogs |
| Topic | |
| Licence / Cost / Platform | Web tool that runs as a Template:Plugin within the WordPress(tool) blogging platform |
| Subject / Categories | |
| Teaching Ideas / Links | |
| Link | |
to collaborate on the web:
Document sharing
Message and video conference at “HALL”
HALL (hall.com) provides real-time collaboration(i) one-on-one messaging(i) and video conferencing(i) for project teams. It is a business tool to provide an always-open window between people who may work together over the web, via their PC desktop or on their mobiles. School use appears not be excluded from these benefits.
Create a study area at STUDY HALL
Study Hall (i1.studyhallapp.com) is aimed at education and it allows you to create a virtual study area on the web. Here you can upload notes(i) and assignments and also support your students via mobile apps or social networks. The thinking behind this application is that learning is about “thought provoking discussion(i)s with peers and teachers”. Study Hall provides the means to connect people.
WIKISPACES (wikispaces.com) is a website like Wiki(i)pedia. Here you can write your own information pages. Unlike say a blog, what is typed can be rewritten by others – and perhaps edited mercilessly. Your choice of topic could be as wide as providing an entire course or you could use it to have a class share their experiences of say, a field trip.
DROPBOX (dropbox.com) offers online folders where you can store and share files(i). The files can be synchronised with your computer desktop or mobile device. Public folders, for example, offer a simple way to share notes(i) or homework by simply circulating a link to the folder.
Co-create documents at Google Drive
Google Drive – Google Docs - drive.google.com If you need to collaborate(i) over some text, a spreadsheet or a presentation, people with a Google account can edit the same document at the same time. One day, probably yesterday, it will be as passé as keeping all your work in the cloud(i)!
to communicate
Word processor
More than typing, word processing(i) is a way to improve the quality of writing. Word processing allows pupils to reflect on, and improve finished work.
Not everyone responds well to a blank screen, hence teachers may create lists of questions(i) as a writing frame(i) to drive a writing activity [scaffolding]. One such “template” for science might include hints for writing a lab report. (It might ask for example, what were you trying to find out? Which results are useful? How do your results explain your idea? ’Why do you think that happened?).
Several of the ICT tools below provide pupils with a wider audience than just the person that marks it. Which means that writing news, a review, a radio script or a campaigning blog(i) can have a real purpose [authentic task]. Note also that several ICT tools permit pupils to collaborate(i) interestingly over the network.
Presentation tools
Add information to school displays with QR codes
QR CODE GENERATOR (qrcode.kaywa.com) allows you to make the 2D patterns used in advertising. The gain is that you can get data into a mobile device without typing. The data could be text, a web link or contact details. You could for example use QR code(i) patterns to offer information of objects in a display cabinet, or make use of the time pupils spend queuing in the corridor, put a QR code(i) with useful facts on the classroom door.
to communicate using media
Keep an online notebook at PENZU
PENZU penzu.com offers means to keep an online note(i)book, and it actually looks much like a paper version, It can be used to keep a personal journal or lab notebook
Make an activity for a whiteboard at TRIPTICO
Triptico (www.triptico.co.uk) is a desktop {tag|app}} with tools, such as a way to move words around. It lets you create resources for a whiteboard(i). It is said to very easy.
Make a class website at WEEBLY.COM
WEEBLY (education.weebly.com) is a way for a class to make a project website(i). Students have various ways, such as adding multimedia to help express themselves. The work involved can happen away from the public internet and in a safe space that is under control of the teacher.
Add a voice to an animated character at VOKI.COM
VOKI (voki.com) is a made for school tool where you choose an animated(i) character and give them a voice to explain a topic or tell a story. Students select an avatar and make them talk either by typing or talking. A class manager allows the teacher to set assignments and manage logins.
Set up a class group in FACEBOOK
FACEBOOK (facebook.com) has been used by teachers to set up a social network(i) group and connect with students. Facebook is common currency and as such is highly accessible to many. It may be rather close to home for others.
Broadcast your science project at USTREAM
While USTREAM (www.ustream.tv) looks like youtube done differently, it offers an edge in allowing a live broadcasting(i) over the net. A school or class could have a channel to broadcast with little more than a camera. USTREAM is used by big name broadcasters and families alike.
Writing – Blogs
Still a popular approach to teaching, and still underused, blogging(i) is the easiest of ways to publish school news or lab discoveries. Blogging environments allow video and photos to be included alongside text. Each of the following blogging site alternatives offers an overwhelming range of features. See BLOGGER (blogger.com); WORDPRESS (wordpress.org) and TYPEPAD (typepad.com)
to present
Make a panoramic presentation at VUVOX
VUVOX (www.vuvox.com) is a tool to make presentations(i) such as photo panoramas(i) with hot-spots. Imagine VUVOX as a way to make a set of Powerpoint slides that scroll across the screen. You can add a range of media and interactivity to the result.
Brainstorm at WALLWISHER
WALLWISHER (wallwisher.com) is a notice board(i) where you can plan, discuss and brainstorm(i). Use it to add questions, post-it notes(i) and add comments(i). It is easy to sign up and use it immediately.
Make a timeline animation at KERPOOF
KERPOOF (kerpoof.com) allows primary age pupils to make artwork(i) and timeline(i) animation(i). It can be used to tell and illustrate a story.
Make a safety campaign poster at GLOGSTER
GLOGSTER (edu.glogster.com) is like an onscreen poster(i) where you can add music, photos, videos to record an event, or a science project. The posters can be published on social sites and this happen inside a teacher-managed login.
Brainstorm at CONCEPTBOARD
CONCEPTBOARD (conceptboard.com) is a ‘web space’ to discuss and brainstorm(i) ideas and documents for a project say, and as an alternative to trying to collaborate(i) via email. It was designed to enable team work and conferencing.
Record a conversation between animated characters at XTRANORMAL
First sights of XTRANORMAL (xtranormal.com) character animation(i) tool may deceive that this is for learning languages. However, XTRANORMAL enables students to make narratives(i) and conversations that explain almost any topic. We have seen it used to handle a question and answer session on student options. Animation is edited on a timeline. Voice can be added by talking or typing.
Presentations with pans and zooms - Prezi - prezi.com
Create presentations(i) with flair, import Powerpoints and share your work. Invite students to a meeting where they can co-edit a project, adding video or pictures. Embed a presentation in a blog; export to a self-playing file and publicise it using Facebook. (Free and premium accounts available)
Use a web browser to draw(i) a picture, flowchart or diagram with the help of a library of clip-art ‘stencils’. You can use the flowchart to create a teaching resource to share it with the rest of the class. A chat(i) window enables collaboration(i) with each other. Results can be exported to a versatile file or embedded in a blog page.
to collect data and measure
Sensors(i) are obviously tools for measuring in science, but why might they be better than regular tools? Are they more accurate; more convenient or less costly? On these points alone, they are certainly no better than an everyday device such as a thermometer.
Sensors and data loggers(i) are in part ‘special’ because they can display fast changes and measure with precision. A temperature sensor linked to a live graph can give us a better insight into how a cup of coffee cools. Sensors also extend the range of things we can measure - from timing a falling mass to recording human pulse changes during a race. Importantly, a live display of a changing measurement can provide pupils with a tacit understanding for the changes they will investigate.
An accelerometer(i) might give an insight into gravity by directly measuring it. Another sensor, called a light gate(i), might show how acceleration is derived from measuring distance and time. These examples aim to highlight that deriving some benefits from data logging may depend on the design of the teaching activity. The idea that is key is that the benefits from using sensors are not always automatic.
Nearby are examples to evaluate what sensors bring to science.
Data logging
[nearby DATALOGGING BOOK LINK].
to handle and analyse data
Handle data with a spreadsheet
A spreadsheet(i) probably found itself in school by accident, but in no time at all, its calculating(i) and graph(i) drawing abilities found it a secure place. In science teaching, a spreadsheet is a ready-made results table that quickly produces a graph. Graphs are a key tool for analysing data and a spreadsheet makes them with ease. In fact, spreadsheets can produce an astounding range of graphs. Our role as science teachers may be to encourage pupils to communicate effectively using graphs.
The ability of spreadsheets to organise, record and analyse data are aspects of exploring science. If you had a table of students’ personal data, you could sort it into order of shoe size, or work out the average size of the class. You could draw a bar chart to see how the shoe sizes vary across the class. Or draw a scattergraph to see if the sizes vary with height. You might also search for those with black hair and see if they have an eye colour in common. Students can similarly use a spreadsheet to sort and search for patterns in the properties of elements in the periodic table
It may be clear already that students using a spreadsheet in these ways have to work scientifically. They would need to define what they want to find out, collect data, organise it and analyse it. A case can be put that the use of a spreadsheet belongs, and probably deserves a place in science teaching.
Handle data with other software
Spreadsheets have an astonishing range of functions that help with maths or modelling. They appear to turn any mathematical trick so there may be an assumption that spreadsheets are the tool to handle all calculations and graphs.
However, there are other tools. Furthermore, they may be designed for tasks we need to do in school and actually do things that a spreadsheet does not do. For example, there are data handling packages designed for use with data collected from sensors(i). These packages can take reading at points on a graph(i); calculate(i) net changes; calculate graph areas; plot a rate of change against time and these things can often be done with less IT training and more efficiency.
to model an idea and visualise
Explain ideas using animation(i)
It is hard to imagine a really piece of communication that does not benefit from graphics. Numerous tools allow students to draw, photograph, and make video and animation. (SCRATCH; POWERPOINT). Some, if not many learners, adapt well to working with visuals and thus teachers can exploit this. For example
- Make a step-by-step visual guide(i) to an experiment
- Make a puzzle where you must put a series of steps in the right order
- Animate(i) a story to explain what happens in photosynthesis
- Animate(i) the orbit of the earth to explain the phases of the moon or the reasons for seasons.
- Make a timelapse(i) movie of a plant growing towards the light
- Write a dialogue(i) where animated(i) characters discuss(i) two sides of an environmental issue
Animation(i), models(i) and simulations(i)
Many science ideas are perhaps best experienced and animation(i) offers a way towards providing some experience. An Internet search easily finds free and commercial simulations of popular topics such as the heart cycle or kinetic theory. You may even have skills with animation tools (Adobe Edge; Sketch; PowerPoint; whiteboard(i) software) that allows you to create an animation for a teaching need.
One side point is that you will find the terms ‘models(i)’ and ‘simulations(i)’ used with varying amounts of accuracy. Each term refers to a distinct type of experience although the distinction is blurred in practice. A model and a simulation of say, animated solids, liquids and gases can look very much the same on screen. The simulation allows you to explore but the model allows you explore more. To qualify as a model of kinetic theory, it needs to let you inside it to play with assumptions it uses to work.
But how do you imagine that animation(i) might be used for teaching? Do you imagine that the teacher discusses the animation on the whiteboard(i)? Would it always be better that students use it for themselves? If so how would you structure that activity? Is there a space for students to makes their own animations? And does it always follow that learning with animation should entail some kind of inquiry(i) learning?
Modelling with a spreadsheet
An interesting feature of a spreadsheet(i) is its potential for teaching about ‘modelling(i)’. If you had information about the gravity force on celestial bodies, you could get the spreadsheet to work out how much you would weigh on each of them. This 'spreadsheet' could then be called a mathematical model: it provides an alternative to actually going to the moon to weigh yourself.
You can use a spreadsheet to build models as complicated as you wish. You can model the gas laws, chemical equilibrium and the Hardy-Weinberg distribution law. Nearby [IT in Secondary Science] is a model to show which methods of home insulation are cost effective. One could, for example, adapt this to compare solar panels and other home energy solutions.
Modelling offers a way to examine a hypothesis that arises at some point in your workscheme. Here are a few ideas that have been tried
- Use a spreadsheet to examine braking distances of a car under wet and dry conditions. Experiment with a model of the use electricity in the home.
- Experiment with a model showing your daily requirements for energy.
- Use a spreadsheet to model heat loss from the home. Use it to find the most cost-effective methods of home insulation.
Model geometry with GEOGEBRA
GEOGEBRA (geogebra(i).org) is a tool for modelling(i) in geometry(i). An alluring feature is that you can change parameters on pre-built models using a mouse. You can indeed create models in a way much like drawing on-screen. Remarkably this ‘dynamic geometry’ application, conveniently runs in a browser, but can be downloaded to work offline on a PC.
Map your mind’s ideas at MINDMEISTER
MINDMEISTER (mindmeister.com) is an incredibly simple mind-mapping(i) tool. It lets you put ideas in boxes and link them together - as one does in concept mapping(i). A box can contain a picture or a document or a link to a web site. MINDMEISTER might be used to make a course ‘poster’. Furthermore, several people can work on the same mind map at the same time.
Create word and tag ‘clouds’ at TAGCLOUD
WORDLE (wordle.net) makes a ‘word cloud(i)’ showing the frequency of the words used in a document. You can ‘feed’ the website a web page of text; a blog or whatever text is in a clipboard. You could feed WORDLE with your entire work scheme or the collected work of the class. Typically the bigger the word displayed, the more frequently it has been used. Wordle can be used to make an informative cover page for a project, or to see how tediously tedious one can write!
A visitor to TAGCLOUD (tagcloud.com) may wonder how it is different to WORDLE above. However the words in tag cloud(i) are live links. You could make a cloud from the syllabus text and every tag might start a Google search. A tag cloud can be embedded in a web page and the words can be confined to a picture, say, of the shape a chemistry filter funnel.
to present
Describe your experiment on video
Video may already be the most popular way to communicate everywhere. Schools may be among the few places left. TBC
to find information
Internet
www.scoop.it/edu-search
To teach/work with coding
https://docs.google.com/document/d/1NY1s-s5S3BGnVgGnwA18hTyMIYk4ZkkpVioFiewWFQE/
